
What your team sees
See how teams follow cases, reviews, and results.
These screens show one way your team could work in a live operation.
Swipe the tabs and screen to explore all seven views.
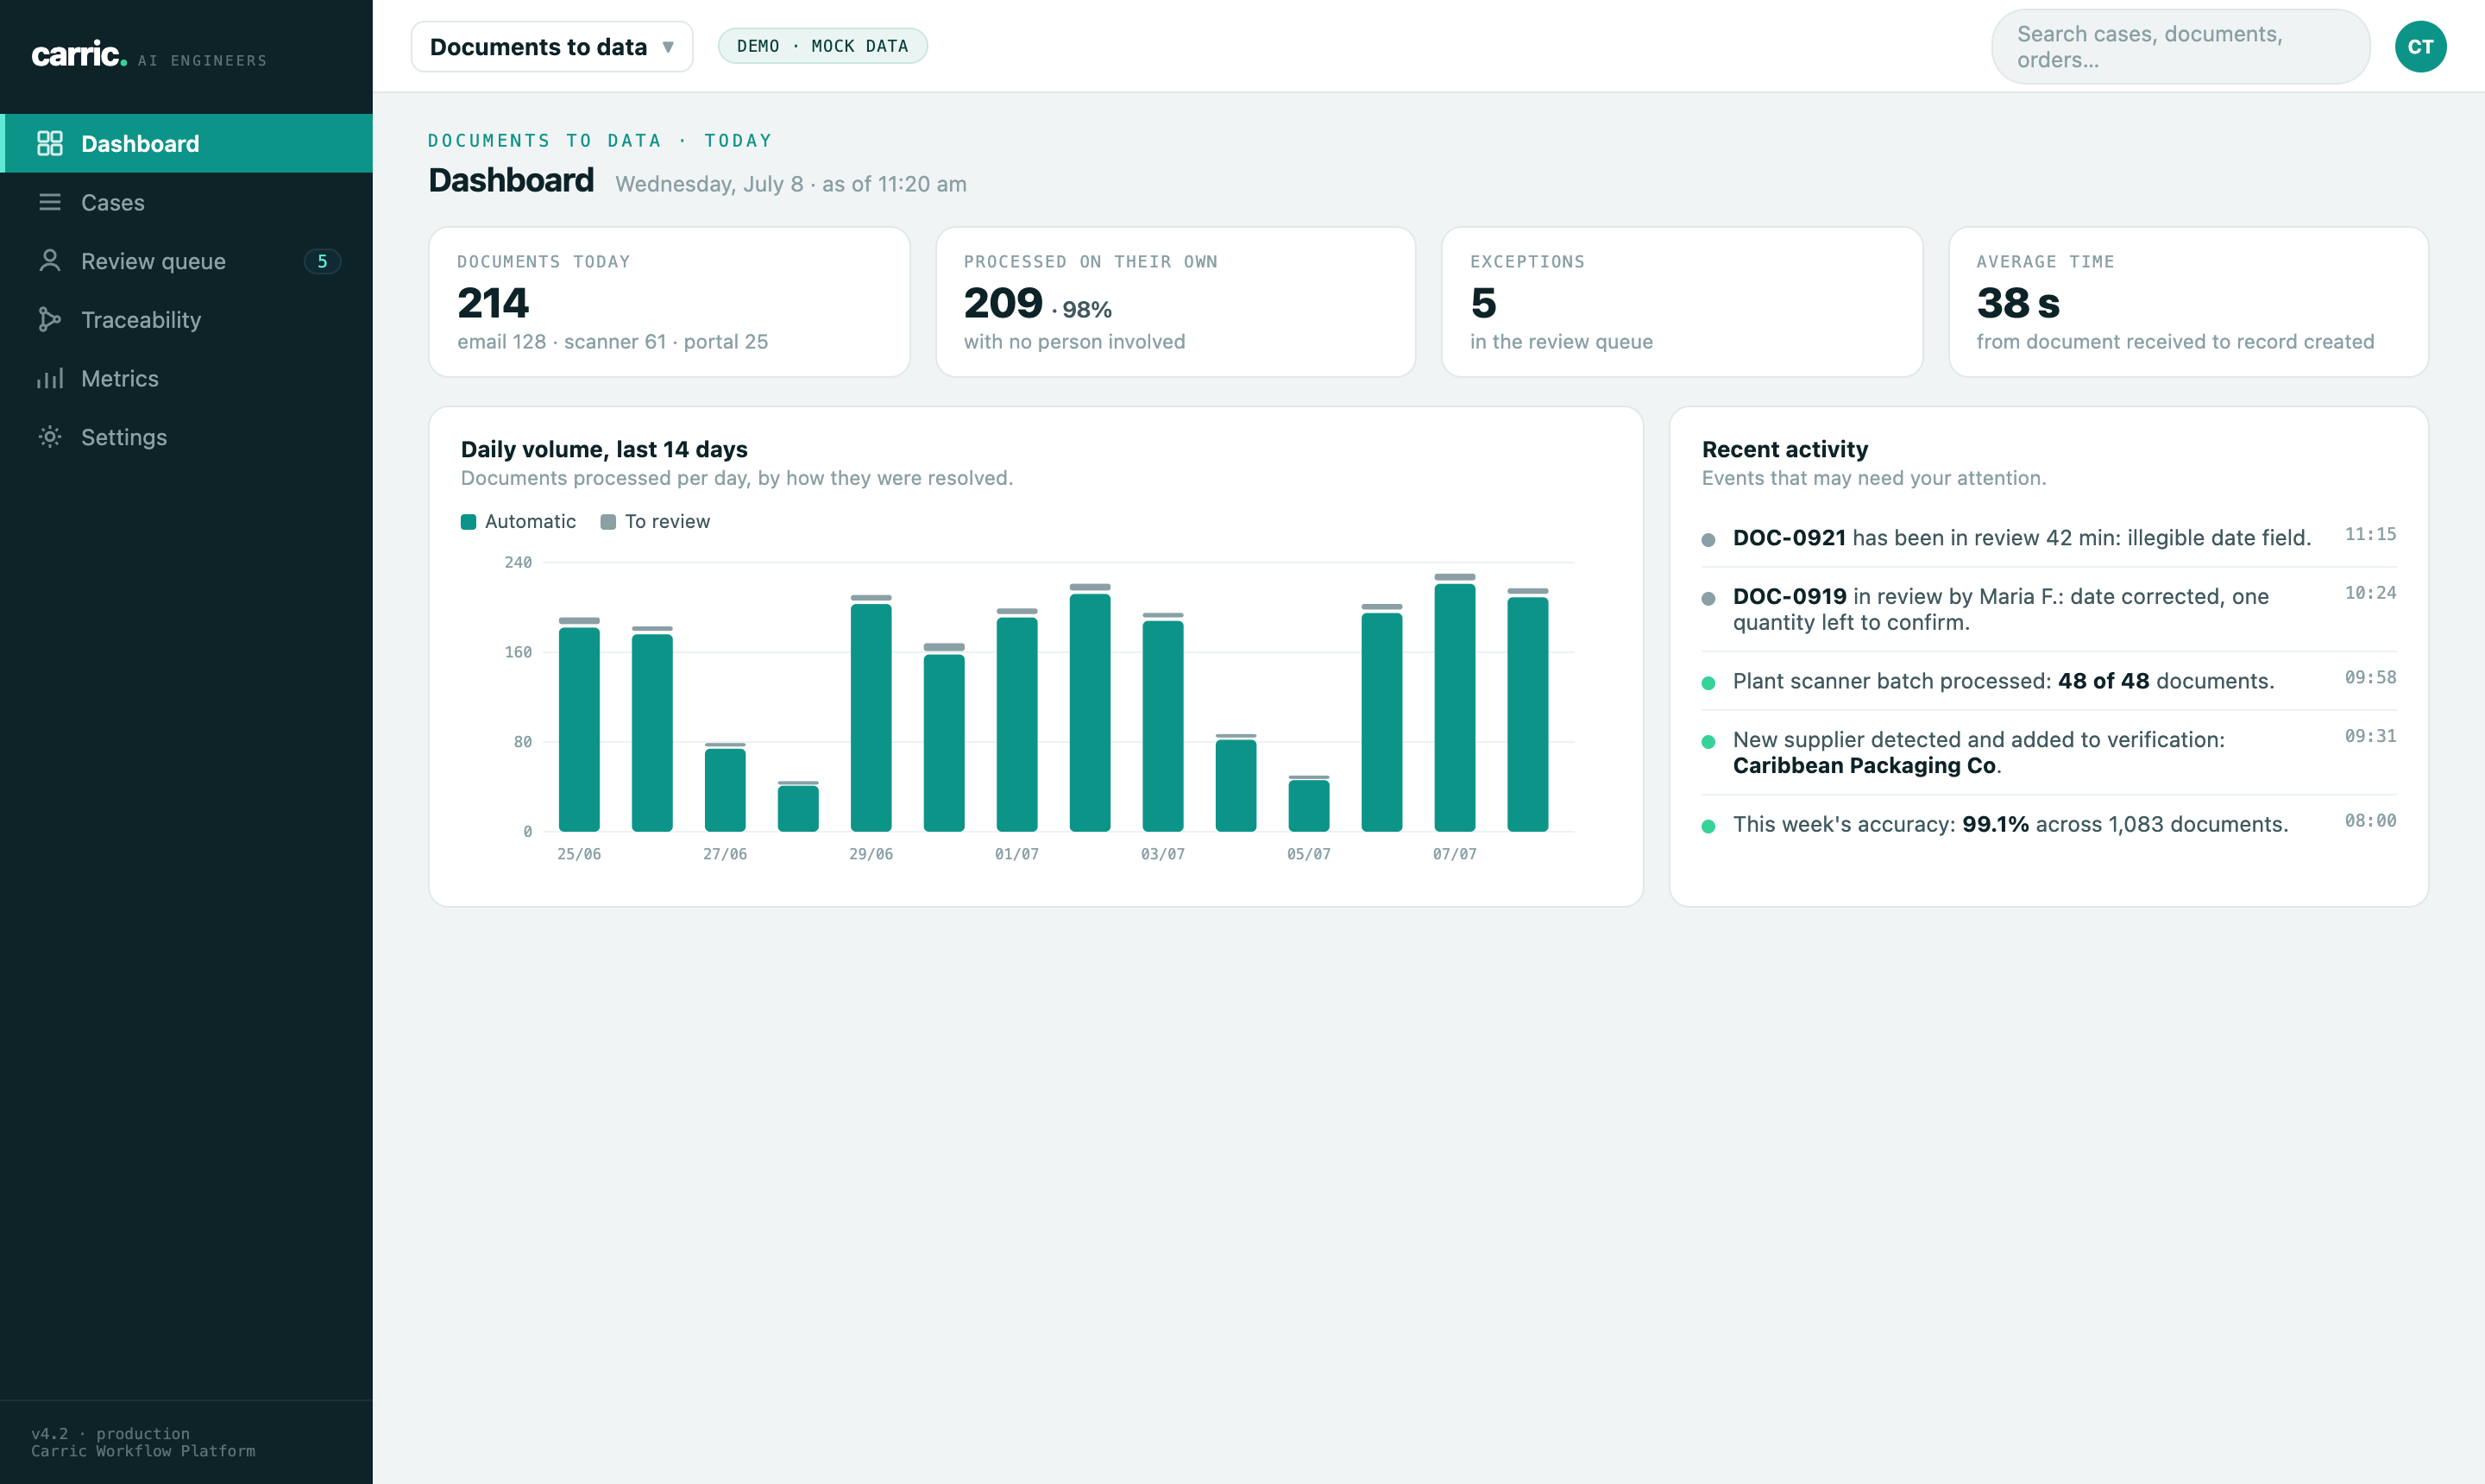
Mock data shows how the interface works. This is not a client system or a live implementation.
Next: How it is built
See how rules, models, people, and controls work together.